
POLICY AND POVERTY: US, UK and China
By: Jackie Connor

I. DEFINING POLICIES AND POVERTY RATE
Which policies are more effective at reducing poverty? We review policy and poverty in the US, UK, and China. In the US we look at six areas of policy in particular: (1) transportation, (2) defense, (3) education, (4) health care, (5) pensions, or (6) general welfare. It may seem easy to differentiate between the six broad policy categories. In practice, the meaning of each of the six terms is debatable. The following gives the definitions used in this paper. Readers may refer to the Appendix for specific government codes.
1) Transportation:
In general, transportation includes air, water, and ground transportation and transit. This category includes the construction of ships, grants for safety programs, the construction of highways, and related research and development projects. [1]
2) Defense:
Defense pertains to research and development, military construction, operation and maintenance. Aid to veterans (training, housing, hospital fees), foreign military and economic aid, money spent to maintain and operate facilities fall under this category. [1]
3) Education:
Education encompasses primary through tertiary schooling as well as job training. In addition to services with which most people are accustomed, education spending also includes social service programs to families and the disabled and general research. [1]
4) Health Care:
Health care can be split into two primary categories: medical services and vendor payments. This category is dominated by multiple medical programs such as HI (hospital insurance), SMI (Supplemental Medical Insurance), Medicare, and Medicaid. Research and development, consumer safety, and abuse and mental health programs also fall under health care spending. [1]
5) Pensions:
There are two main pension categories: old age and sickness/disability. These programs include OASI and DI benefits, insurance funds, and employer and employee retirement contributions, among others. [1]
6) General Welfare:
General welfare caters to the disadvantaged and unemployed. This spending includes nutritional aid to families, social exclusion benefits, unemployment compensation, and housing assistance. [1]
Poverty Rate
Like the policy categories, the answer to the question “What is the poverty rate?” will result in multiple answers as many forms of poverty rates exist. Some are absolute rates, while others are relative to the general population. Others describe long term, youth, racial, regional, or monthly poverty.
General Definition:
The all encompassing annual poverty rate is the focus here. As its name indicates, annual poverty is defined as percent of all people in poverty in a calendar year. [2]
Specifics:
We rely on the Census Bureau’s poverty status determinations, which are recalculated each year. The status of a family is based on two factors: (1) income and (2) need. If income is greater than need, a person is not in poverty. If income is less than need, then the person is in poverty.
First, income includes before tax earnings, compensations, benefits, pensions, child support, assistance, Social Security income, among others. Non-cash benefits and capital gains/losses do not count. For families, income is the aggregate of all family members.
Second, people can be placed into 48 need categories. These categories account for differences in family size and age of members. The required dollar needs for families are updated annually to adjust for inflation according to the Consumer Price Index (CPI). [3]
II. RESULTS
We first rank the six policies based on their correlations with poverty rate. Explanations of the reasons behind the results follow. Throughout this section we will refer to the transportation and poverty rate correlation as T/PR. Likewise defense will be called D/PR; education E/PR; health care H/PR; pensions P/PR; and general welfare W/PR.
Methodology
Time Frame
Each correlation considers the period from 1970 to 2012. There are two opposing factors at play. Years of data are required to measure trends, especially as policies take time to take effect. Data must be recent to be relevant because the United States has undergone many transformations in the past century. This set of forty-two years is a reasonable compromise.
Proportion of the Budget
We use proportion of the US federal budget because ultimately, the only subsequent action the government can take, without worsening its deficit or debt situation, is to adjust budget percentages. Furthermore, the proportion of the budget is preferable to absolute dollar amounts or proportion of GDP. The latter two are poorer indications of the US legislature’s preferences.
Data Sources:
The data for welfare and infrastructure is from UsGovernmentSpending.com, which obtained its data from “Table 3.2 – Outlays by Function and Subfunction” in Budget of the United States Government published by the Executive Office of the President of the United States. [1] The historical poverty rate is from “Table 9. Poverty, by Region” published by the United States Census Bureau. [4]
Policy Ranking
The question of which policies address poverty most effectively may be answered in two ways:
(1) A ranking of which programs should receive more money
(2) A ranking of which programs should be cut.
1) Policies to Emphasize
The stronger the negative correlation with poverty rate, the more spending on a particular policy program decreases poverty. In this sense, the following policies reduce poverty ranked according to best to worst:
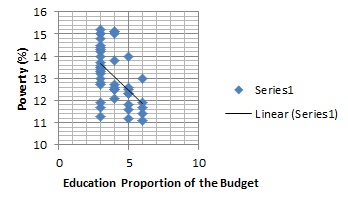
1. Education policies (correlation of -0.5294)
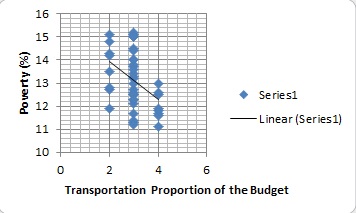
2. Transportation (-0.4087)
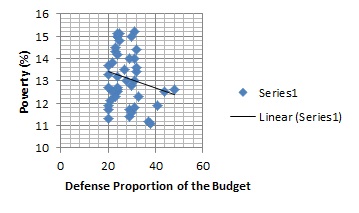
3. Defense (-0.1996)
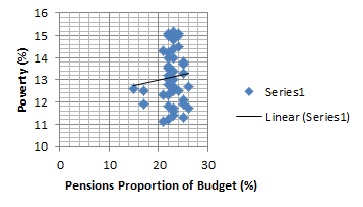
4. Pensions (0.0897)
5. Health care (0.2167)
6. Welfare (0.3492)
Positive correlations indicate increases in such programs increase poverty. As a result, none of the positive correlations—pensions, health care, or welfare—should be emphasized more.
2) Policies to Cut
The policies that have positive correlations with poverty rate should be downscaled. The rankings of policies to cut funding to in order of worst to least worst:
1. Welfare (0.3492)
2. Healthcare (0.2167)
3. Pensions (0.0897)
4. Defense (-0.1996)
5. Transportation (-0.4087)
6. Education (-0.5294)
Ideally, all the negative correlations would not be cut as such cuts may exacerbate poverty. However, if cuts must be made, then the weakest negative correlations should be cut first.
Reasons
1. E/PR: -0.5294 Negative Correlation
The benefits of education are well known. First, obtaining jobs and higher paying jobs, is more likely. Individuals can then afford a higher standard of living. These benefits have a ripple effect through the economy. Improvements can be seen within the family unit. Nationally, as many individuals and families benefit, overall economic productivity increases. This translates into general poverty reduction as governments collect more taxes and have revenues to spend on infrastructure, etc. Government spending further improves job opportunities as individuals continue to gain and regions becomes more attractive. [7]
2. T/PR: -0.4087 Negative Correlation
The core benefit of transportation is economic growth, which is obtained through productivity increases. Capital aids prosperity. For instance, adding roads saves time and increases access to higher-paying jobs that are further away. Higher levels of business investment, tourism, and access to suppliers also result from infrastructure spending. [5]
3. D/PR: -0.1996 Negative Correlation
Many oppose war and overall military spending on humanitarian grounds and common opinion is that such money may be better spent elsewhere. While these concerns are legitimate, military spending can be beneficial in itself by providing jobs, increasing the consumption of goods, and through technological progress and discoveries. [6]
4. P/PR: 0.0897 Positive Correlation
The objective of pensions is not realized in practice. First, pensions fail because they do not keep pace with inflation. Over time, the differences accumulate, ultimately making pensions insufficient. Again, costs are problematic. Investments for pensions do not provide enough return to cover costs. Pension managers have sought out both risky and less risky assets. However, for many pension plans, the returns are unsatisfactory. The shortage means that some individuals–especially those who did not have a plan B because they assumed they could survive with pensions–fall into poverty. [8]
5. H/PR: 0.2167 Positive Correlation
While health care spending is intended to aid poverty reduction, implementation is key. Wrong incentive structures are a problem in healthcare implementation. Health care is often poorly designed and can cause economically undesirable behaviors. For instance, poorer workers are discouraged from getting full time jobs. When employer-based coverage disappears and is replaced by government health benefits, workers realize they can maintain similar lifestyles. [8]
In addition to changing the dynamics of the labor force, health care spending changes the dynamics of the market. Consequently, costs rise exponentially. For example, demand increases in two ways. First: more patients enter the market. Costs also rise as patients unnecessarily request procedures and tests because they do not need to pay for the full cost of medical procedures if they have Medicaid and Medicare. [9] Furthermore, supply changes as many cheaper plans may be outlawed or forced out of the market, hurting certain segments of the population. A vicious cycle ensues as rising costs then pushes some patients into poverty, which leads to more health spending.
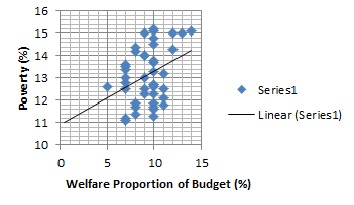
6. W/PR: 0.3492 Positive Correlation
Three reasons are generally given for the lack of effectiveness of welfare.First, the poor may lose the motivation to work, or find further work, if they do not earn more from working than welfare provides. Furthermore, to qualify for aid, people must be below a certain threshold. Being above the line by even a few hundred dollars can lead to significant losses, which leads to unproductive behavior to meet requirements. [10]
Second, welfare often takes the form of short-term relief transfer payments. These however, do not encourage long-term self sufficiency and the acquisition of skills. Consequently, welfare does not help recipients improve skills. As such, welfare is ineffective. [10]
Third, welfare requires money. In order to fund welfare, governments frequently raise taxes. These taxes hurt economic growth, especially since spending is often for unproductive short term relief, by reducing the incentive to work. Thus, welfare indirectly worsens the general poverty rate due to tax impositions. [11]
Limitations:
These correlations, while informative, have their limitations.
Time Lag:
Passage and implementation are separated by months or years. This presents two complications which may skew the results obtained above.
First, the annual poverty rate only includes projects that have been finished by that year, not those planned for in the current budget. Although this analysis accounts for 30 years of data, more analysis may be required to make a more precise relationship.
Second, the time required to complete transportation, defense, and welfare projects are often are different. While the correlations suggest education is overall more ideal, welfare may be a better choice during sudden recessions or emergencies that require quick relief.
Confounding Variables:
Poverty is not simple; it is multifaceted and complex. A person’s risk of being at poverty is shaped by a variety of factors such as globalization, parents’ habits, or discrimination. Consequently, the effects of welfare and infrastructure spending on poverty may be skewed by changes in other variables.
Applicable to an Extent:
The correlations suggest that welfare should be downscaled and that education should be emphasized. However, they fail to answer a significant question: when should you stop downscaling or emphasizing each policy?
Theoretically, the elimination of welfare is best. In practice, decreasing welfare may be beneficial up to a certain point; afterwards, such decreases may be counterproductive. For example, the federal government’s wariness on increasing welfare exacerbated the Great Depression. Despite such limitations, these correlations may be foundational for policy making and further analysis.
III. ANALYSIS
Ethical Implications: Capabilities Approach
We will utilize the “Capabilities Approach” to analyze these correlations. Unlike Rawl’s Distributive Justice that focuses on fairness for the overall economy, the Capabilities Approach discusses how to expand people’s abilities or the opportunities of a particular group, such as the poor, making Capabilities a more appropriate standard. This approach contains three main concepts: (1) functionings, (2) agency, and (3) capabilities. [12]
(1) Functionings
Functionings may be defined as people’s wellbeing and the activities open to them. In this analysis, the ideal functionings refer to living above the poverty line and doing associated activities such as investing in education. [12]
Providing a general number is difficult as there are many types of numbers that are calculated which change each year based on income, family size, and age. For example, in the United States, for a family of four in 2012, their income had to be above $23,492. However, the requirement was only $13,892 for a household of 2 individuals older than 65 years old. [4]
Agency:
Agency concerns the incentive behind actions. Primarily, it considers whether individuals act voluntarily or act as a result of oppression or force. This paper assumes that people act independently. This assumption is rooted in the United States’ free market capitalist ideology. [12]
Capabilities:
Capabilities is the concept in which debate persists. In general, capabilities are the opportunities and freedoms people can utilize to achieve varying levels of functioning. [12] In this paper, capabilities concern the real opportunities provided to the poor so they can escape poverty. This again leads the question: is it better to spend on infrastructure or on welfare, on both, or neither? The correlations indicate infrastructure helps give the poor capabilities and welfare takes away their capabilities. Thus, infrastructure helps achieve a more desirable level of functioning whereas welfare lowers functioning.
US Budget Allocations for Policy Programs over Time
Past and Present
We examine the proportion of US Federal budget accounted by the six categories from 1970 to 2012.
1) Education
Education spending trends as a proportion of the US budget has been declining. Education now makes up 3 to 4% of the budget; in the 1970’s it consumed 5-6% of the budget.
2) Transportation
Transportation, as a proportion of the budget, has remained relatively stable. In 1970, related expenditures accounted for 4% of the budget. As of 2012, this number was 3%.
3) Defense
Unlike transportation, defense spending accounts for less of the budget today than in the past. In the early 1970’s defense was approximately 40% of the budget. However, in 2012, only 24% of the budget was appropriated for defense.
4) Pensions
Pensions also use a higher percent of the government’s resources than in the past. Currently, pension expenditures match health care expenses at 23%. Previously, in 1970, this number stood at 15%.
5) Health Care
Health care has grown in the past 42 years and now uses a considerable amount of resources. These expenditures grew from 6% to 23% in the span of 42 years.
6) Welfare
Like pensions and health care, welfare has become a more integral part of the federal budget, rising from 5% to 12% of the federal budget.
Conclusion
Unfortunately, historical spending trends tell a story of lower and lower levels of functionings for Americans. Rather than increase spending for transportation, defense, and education, spending has decreased. Likewise, the government has increased, rather than reduced, spending for health care, pensions, and welfare. The actions of the US completely contradict the recommendations from the correlations study. The fact the poverty rate has increased from 12.6% in 1970 to 15% in 2012 should therefore, not be surprising.
Future
Information from projected budgets up to 2018 show:
1) Education
On the whole, education should remain the same despite some small fluctuations. By 2018, education should comprise 3% of the budget, the same as in 2012.
2) Transportation:
Transportation ought to remain constant 3%.
3) Defense:
Defense is expected to continue its historical trend and become less significant. If the projections are correct, defense expenditures should drop from 24% to 18% of the budget.
4) Pensions
Like health care, pension spending should also rise. In 2012 it accounted for 23% of the budget; by 2018 it should consume 26% of total resources.
5) Health Care
The trend for health care is likely to continue and rise to 27% in 2018 from 23% in 2012
6) Welfare
Welfare is predicted to buck the trend and fall from 12% to 9% by 2018. This is may be surprising considering every other category is expected to follow historical trends. However, this projection makes sense considering economic recovery expectations. The expected decrease in unemployment compensation is reflected in the budget estimates; unemployment assistance should fall from 93.8 to 48.2 billion dollars between 2012 and 2018.
Conclusion
Despite the reversal in the welfare trend, these findings do not suggest a bright future for the US and its people. Rather, they show the poor will be further from their desired level of functioning as a consequence of defense, health care, and pension policies that increase poverty.
Implications for the United States’ World Status:
Does the direction of these US policies translate into a change in its world status? World ranking revolves around how a nation compares to others. If others improve, the US rank falls; if they remain the same, the US keeps its status; if they deteriorate, the US gains. We divide other countries into two main categories, developed and developing, and examine their spending trends.
Developed Countries
UNITED KINGDOM
Past and Present
The United States may breath a sigh of relief: developed countries’ trends are similar. While there are numerous developed countries, we compare the US to the United Kingdom (UK), which publishes its budgets and budget breakdowns, for a more exact analysis. We continue to use the 1970-2012 time frame for five categories. The United Kingdom’s budget does not have a distinct transportation category. [13]
1) Education
Education expenditures in the UK have remained on par. In 2012, education spending accounted for the same proportion of the budget as it did in 1970: 13%.
2) Defense
Like the US, the UK’s defense spending has dropped. In 1970, the UK allocated 13% of its resources to defense. Now, only 6% is marked for defense purposes.
3) Pensions
Pension spending in the UK grew significantly faster than in the US. The UK spent nothing on pensions in 1970. However, 19% of the budget was considered pension spending in 2012.
4) Health Care
Again, the UK’s direction matches the US. Health care spending has increased in the UK from 10% to 17%.
5)Welfare
Welfare spending is the main difference in the historical trends of the US and UK. While welfare increased from 5% to 12% of the budget in the USt, it fell from 19% to 16% in the UK.
Future
We compare the UK’s projected budget to the US budget. We examine only the UK’s budgets up until 2016, the last year that has been published.
1) Education
Similar to the US, education spending is expected to remain essentially level. While US education spending amounts to 3% of the budget, approximately 13% of the UK budget is dedicated to education.
2) Defense
Defense is expected to take approximately the same amount resources in 2016 as in 2012: 6%. This contrasts with the US, where defense should drop from 24% to 18%.
3) Pensions
UK pension spending should witness a 2% bump, consuming 21% of the budget in 2018 compared to 19% in 2012. For the most part, this matches an expected 3% increase in the US, from 23 to 26 percent.
4) Health Care
Like education, health care should remain somewhat stable. In 2012 the UK spent 17% on health care. In 2018, 18% of the budget is reserved for health expenses. This deviates slightly from the US, where health care should rise 4% to 27% of the federal budget.
5) Welfare
Like defense spending, the future of welfare in the UK deviates from the United States. Although welfare is expected to decrease in the US, the projected figures for the UK suggest it will remain a constant 16% of the budget.
Conclusion
Overall, developed countries, in particular the UK, appear to be following the same trajectory as the United States. In the past 40 years, four out of the five categories had the same trend. For the next several years, spending trends should generally move in the same direction in the two countries. Although welfare and defense spending differ slightly, their effects theoretically may cancel out as the extra decrease in defense spending – which increases poverty – coincides with decreases in welfare spending – which decreases poverty.
Reasons for Projected Spending Trends
These trends naturally beg the question of why, since such spending, decreasing defense, increasing pensions, are harmful according to the correlations. We examine two possible reasons: the structure of political systems and needs of developed countries.
Two features inherent in political systems of developed countries, may lead to undesirable long run spending trends. First, voting is central to many developed nations. Out of self interest, politicians may resort to temporary measures to garner votes and raise their popularity among certain segments of the population. Second, lobbying is common. While lobbying may be good, it can also lead to poor expenditure choices.
Budgets also reflect societal changes. Demographic changes can increase demand. For instance, aging populations require more healthcare and pensions. Likewise, the 2007 financial crisis or an influx of immigrants may lead to more welfare spending. While these types of spending may temporarily alleviate problems, the correlations indicate that structural changes or other types of spending, such as education, are better for a country’s long-term status.
Ultimately, the US and other developed countries should be worried: the trends and correlations indicate they may be moving away from ideal levels of functioning. What is the status of the US and UK versus the policy actions of developing nations?
Developing Countries
CHINA
Are we right to worry the US will lose its position relative to developing countries? We focus primarily on China for obvious reasons. We examine five of the six categories. We do not examine general welfare, as China often categorizes pensions and health care under welfare.
As data, such as budgets, produced by China are extremely questionable and difficult to locate, we abandon our previous framework of calculating the category of spending as a proportion of the budget. For both China and the US, we focus on percent of GDP as such data are more widely available. Additionally, we disregard the 1970 to 2012 timeframe for this comparison. Instead, we match the US time frame to the available Chinese time period. Lastly, we compare the spending from all levels of government, local, national, provincial, for both countries as China’s statistics do not usually differentiate between the two. This measure differs from the previous US and US to UK calculations, which focused solely on spending at the national level.
Past and present
1) Education
Education spending has increased slightly. In the 18 years between 1992 and 2010, education spending as a percent of GDP only increased 1%, from 2.7% to 3.7%. [16] Like China, education has changed little as a proportion of GDP, between 1992 and 2010 in the US. It increased from 5.51 to 6.3% of GDP.
2 )Transportation
China has implemented multiple Five Year Plans. Consequently, as a proportion of China’s GDP, infrastructure doubled from 5.7% in 1998 to 14% in 2006. [14] In contrast, US transportation expenditures remained relatively the same, with a slight increase from 1.62% of GDP to 1.71% from 1998 to 2006.
3) Defense
It comes as a surprise that China’s military spending as a percent of GDP has been somewhat level over the past two decades. In 1990, China’s military spending accounted for approximately 2.6% of its GDP. This number dropped 1.8% in the mid-1990’s, but has risen to 2% of GDP as of 2013. [15] The US has also noticed a slight decrease since 1990. In 1990, US defense funding stood at 5.9% of GDP. In 2013, this number was 5.08%.
4) Health Care
Between 2004 and 2011, China’s health care spending increased from 1.8% of GDP to 2.89%. [17] Health care spending in the US reflects China’s, as seen by its 6.1% to 7.77% over 7 years.
5) Pensions
In the span of 20 years – 1990 to 2010 – China’s public pension spending as a part of its GDP increased from 1% to 3.4%. [18] The US also increased pension funding, but less than China. In the same 20 year time frame, spending increased from 6.3% to 6.8% (IMF).
Future
Determining future spending for developing countries is more difficult than examining past expenditures. These countries are often unpredictable as they respond to urgent events or are devising new plans that may alter their countries significantly. Others are hesitant to provide estimates for strategic or expectation reasons or because of criticism. Information released is often sporadic and hard to compare due to time frame differences.
Available information, nevertheless, indicates these countries will continue their current efforts. For example, China is expected to continue its recent defense efforts. By 2015, China should channel 2.18% of its GDP, up from its 2013 level of 2%, into defense spending. [19] Likewise, China’s pension spending is expected to increase from 5% of GDP in 2009 to about 6.5% in 2018. [20]Furthermore, between 2010 and 2030, China is expected to increase pension spending by about 3%. [21]
Conclusion
Overall, the numbers, for both the past and future, paint an unclear picture. On one hand, China has been increasing, and will continue to increase, expenditures in health care and pensions. This trend is noticeable in other developing countries as well. While the United States has increased such spending as well, it will do so by a smaller amount. This implies China’s relative status will drop or stay the same. On the other hand, China’s infrastructure and education expenditures, for example, will lift China’s standing.
Reasons for China’s increasing spending on healthcare and pensions
Again, we ought to ask why China pursues policies of increasing spending on categories that are theoretically harmful. Once again the answer lies in the political system and social needs. Unlike developed countries, developing countries may be less democratic in terms of voting. Rather, they tend to be more authoritarian. Those with power seek to maintain their status. However, these political systems are often threatened by instability. To satisfy the population and undermine anti-government movements, developing countries may dole out benefits and programs.
More importantly, developing countries face a wider array of problems ranging from hunger to illiteracy to hygiene issues and diseases. Consequently, they may be forced to spend more on health care, pensions, and welfare in order to combat such issues.
Limitations for both Developed and Developing Analyses
It is important to consider four other factors: the rate of increase/decrease, how effective budgets are, possible long-term improvements from theoretically undesirable spending, and absolute dollar amounts.
The above conclusions are only qualitative as they categorize spending trends based on whether they are stable, increasing, or decrease. However, they do not mathematically account for differences in rates of change. For instance, they do not determine whether a 3% increase in pensions is better or worse than a 6% change in defense based on their numerical effect on poverty.
Second, a budget describes a country’s general plans. However, they do not communicate the effectiveness of programs. Some countries may invest in more successful projects while others may waste money through corruption.
Furthermore, the conclusions from the US correlations may not hold true for other countries. For instance, health care spending in developing countries may in fact lead to significant long-term improvements in productivity; children suffering from malnutrition are often developmentally stunted, which affects their performance as adults.
Lastly, proportion of a budget or GDP does not reflect the change in absolute dollars channeled into programs. For instance, China’s economy has grown significantly in recent decades. In contrast, the US growth has been more constant. The ultimate benefit to China’s programs, compared to previous years and the US, is larger. This magnification, however, is not reflected above and may increase China’s status relative to the US. For example, while the numbers above suggest China is decreasing money to defense programs, it actually has increased its defense budget. In the 1990’s, China spent relatively little on its military. However, annual defense spending rose from over $30 billion to $120 billion between 2000 and 2010. [22] This trend has continued. In 2013, China is believed to have boosted spending by 10.7%, from 669 to 740 billion yuan. [23] China’s investments and newfound strength can be seen in its increasing demands and heightened tensions with its neighbors.
The above trends do not account for these factors, which may alter the impact on world ranking and quality of life measures. Nevertheless, the conclusions obtained earlier are useful for an awareness of policy prioritization and national comparisons.
IV. ALTERNATIVE PROPOSITIONS
Our analysis suggests the US ought to switch from welfare to infrastructure. However, obstacles, such as political polarization, may impede reform. The US may want to also explore two alternative routes.
First, bypassing the federal government completely can produce tangible results. States and municipalities, especially those where one party has a solid majority, can independently adjust their expenditures.
Second, Americans can look beyond all levels of government. Citizens can work with external organizations that focus on other poverty factors. Opportunities for, awareness about, integration with, and open mindedness towards disadvantaged groups can enable their success.
Appendix:
This section lists the specific US government codes that are used in each of the six categories.
Transportation: 401, 402, 403, 407, B01, B46, E01, E44, E45, E47, E87, F01, F44, F45, F47, F87, G01, G44, G45, G47, G87, B94, E94, F94, G94, and I94.
Defense: 151, 153, 154, 155, 156, 051, 053, 054, 152, 059, 701, 702, 703, 704, 705, E84, E85, F85, G85, and J85.
Education: 501, E12, F12, G12, 502, E16, E18, F16, F18, G16, G18, 251, 253, 254, 255, 503, 504, 505, 506, B21, E19, E21, E52, F21, F52, G21, G52, and J19.
Health Care: B42, E32, E36, E38, F32, F36, F38, G32, G36, G38, 554, B43, E27, F27, G27, 552, 553, 551, B74, E73, E74, 572, 573, 574, 575, 576, 577, 581, 582, 583, and 584.
Pensions: 601, Y14, 654, 655, 602, 951, 952, X11, X12, X14, 652, 653, and 656
General Welfare: 605, E67, E68, J67, J68, 603, B22, E22, F22, G22, 604, B50, E50, F50, G50, 609, B79, E75, E77, E79, F75, F77, F79, G75, G77, G79, Y53, Y54, Y05, and Y06. [1].
References:
[1] Chantrill, Christopher. US Government Spending. n.d. http://www.usgovernmentspending.com/.
[2] United States Census Bureau. Definitions. n.d. http://www.census.gov/hhes/www/poverty/methods/definitions.html.
[3] United States Census Bureau. How the Census Bureau Measures Poverty. n.d.
http://www.census.gov/hhes/www/poverty/about/overview/measure.html.
[4] United States Census Bureau. Historical Poverty Tables – People. n.d. http://www.census.gov/hhes/www/poverty/data/historical/people.html.
[5] Runsinarith, Phim. Infrastructure Development and Poverty Reduction: Evidence from Cambodia’s Border Provinces. Nagoya University Graduate School of International Studies , 2010.
[6] Pollin, Robert, and Heidi Garrett-Peltier . The U.S. Employment Effects of Military and Domestic Spending Priorities. Amherst, Massachusetts: Department of Economics and Political Economy Research Institute University of Massachusetts, 2007.
[7] Berg, Servaas van der. Poverty and Education. The International Institute for Educational Planning and International Academy of Education by UNESCO, 2009.
[8] Weisman, Jonathan, and Annie Lowrey. Health Care Law Projected to Cut the Labor Force. February 4, 2014. http://www.nytimes.com/2014/02/05/us/politics/budget-office-revises-estimates-of-health-care-enrollment.html.
[9] Liebowitz, Stan. Cato Policy Analysis No. 211: Why Health Care Costs Too Much. CATO Institute, 1994.
[10] JR., HOWARD BAETJER. Does Welfare Diminish Poverty? April 1, 1984. http://www.fee.org/the_freeman/detail/does-welfare-diminish-poverty#axzz2q4V5o5sl.
[11] Kenworthy, Lane. Do Social-Welfare Policies Reduce Poverty? A Cross-National Assessment. The University of Arizona, 1999.
[12] Mahasweta M. Banerjee PhD & Edward R. Canda PhD (2012): Comparing Rawlsian
Justice and the Capabilities Approach to Justice from a Spiritually Sensitive Social Work Perspective, Journal of Religion & Spirituality in Social Work: Social Thought, 31:1-2, 9-31
[13]
Chantrill, Christopher. Total Public Spending. n.d. http://www.ukpublicspending.co.uk/total_spending_2012UKbn.
[14] Sahoo, Pravakar, Ranjan Kumar Dash, and Geethanjali Nataraj. IDE Discussion Paper No. 261 Infrastructure Development and Economic Growth in China. Discussion Paper, Institute of Developing Economies, 2010.
[15] The World Bank. Military expenditure (% of GDP). n.d. http://data.worldbank.org/indicator/MS.MIL.XPND.GD.ZS.
[16] UNICEF. Education. 2013. http://www.unicef.cn/en/index.php?m=content&c=index&a=show&catid=203&id=3755.
[17] HEALTH EXPENDITURE – PUBLIC (% OF GDP) IN CHINA. n.d. http://www.tradingeconomics.com/china/health-expenditure-public-percent-of-gdp-wb-data.html.
[18] Fiscal Affairs Department. The Challenge of Public Pension Reform in Advanced and Emerging Economies . International Monetary Fund, 2011.
[19] Hille, Kathrin, and Carola Hoyos. Chinese defence budget set to double by 2015. February 13, 2012. http://www.ft.com/intl/cms/s/0/7b58ac0a-5592-11e1-9d95-00144feabdc0.html.
[20] Sussmuth-Dyckerhoff, Claudia, and Jin Wang. China’s Health Care Reforms. Health International, 2010.
[21] Clements, Benedict. Global Trends in Public Pension Spending and Outlook. International Monetary Fund, 2013.
[22] The Economist. The dragon’s new teeth. April 7, 2012. http://www.economist.com/node/21552193.
[23] Bloomberg News. China Boosts Defense Spending as Military Modernizes Arsenal. March 5, 2013. http://www.bloomberg.com/news/2013-03-05/china-boosts-defense-spending-as-military-modernizes-its-arsenal.html.
Photo: Courtesy of Flickr, Jill/Blue Moonbeam Studios